Article Text

Abstract
Background: Six cholinesterase inhibitors (ChEIs) have been tested in people with Alzheimer’s disease, using methods currently required for regulatory approval. The clinical importance of their treatment effects is controversial.
Objective: To determine whether cholinesterase inhibition produces treatment effects in Alzheimer’s disease that are large enough to be clinically detectable.
Methods: Overview analysis of published trials of ChEIs in which the Alzheimer’s Disease Assessment Scale—Cognitive Subscale (ADAS-Cog) and a global clinical measure were primary outcomes. Two quantitative summary measures of the treatment effect (Cohen’s d and the standardised response mean (SRM)) were calculated and presented as funnel plots. Observed cases analyses and intention to treat (ITT) with the last observation carried forward (LOCF) analyses were compared.
Results: The median Cohen’s d effect sizes (ES) using ITT samples with LOCF for the ADAS-Cog were: low dose of a ChEI (n = 8 studies) median ES = 0.15, range = 0.03–0.22; medium dose (n = 13) median ES = 0.23, range = 0.12–0.29; high dose (n = 9) median ES = 0.28, range = 0.01–0.31. In general, the ES were larger when calculated as SRMs (for example, high dose ChEI studies, median SRM = 0.47; range = 0.30–0.63) and highest in the observed cases analyses (for example, high dose median SRM = 0.56, range = 0.35–0.78).
Global clinical scales produced similar estimates of ES (for example, high dose ChEI, ITT/LOCF median Cohen’s d = 0.29, range = 0.20–0.47).
Conclusions: ChEIs produce small-moderate effect sizes in clinical trials which are reproducible and demonstrate a dose response. Better descriptions of the patterns of treatment response are needed to guide individual patient decisions about the effectiveness of treatment, but group effects are evident and appear large enough to be clinically detectable.
- Alzheimer’s disease
- systematic review
- cholinesterase inhibitors
- AD, Alzheimer’s disease
- ADAS-Cog, Alzheimer’s Disease Assessment Scale—Cognitive Subscale
- ChEIs, cholinesterase inhibitors
- CIBIC-Plus, Clinician’s Interview-Based Impression of Change Plus Caregiver Input
- ITT, intention to treat
- LOCF, last observation carried forward
- OC, observed cases
- SRM, standardised response mean
Statistics from Altmetric.com
- AD, Alzheimer’s disease
- ADAS-Cog, Alzheimer’s Disease Assessment Scale—Cognitive Subscale
- ChEIs, cholinesterase inhibitors
- CIBIC-Plus, Clinician’s Interview-Based Impression of Change Plus Caregiver Input
- ITT, intention to treat
- LOCF, last observation carried forward
- OC, observed cases
- SRM, standardised response mean
Although cholinesterase inhibitors (ChEIs) have been used for several years to treat Alzheimer’s disease (AD), scepticism about their effectiveness persists. Many trials are short, the outcome measures are problematic, trials patients are generally healthier than most with the disease, and the treatment effects seem small.1–12 Moreover, there is concern about how the data have been analysed.13 Given that decline can be expected even in short trials, and that ChEIs engender more side effects than placebos, intention to treat (ITT) analyses that employ a last observation carried forward (LOCF) method of handling missing data are suspect. Briefly, the concern is about so-called drop-out bias,13 which occurs when patients who withdraw have systematically different outcomes than those who do not. While it is easy to imagine circumstances under which an LOCF analysis would be conservative—for example, if patients actively treated withdraw before they can recover from their illness, in the setting of AD trials, dropout bias could actually favour treatment. This would be the case if patients on active treatment more often withdrew early, due to side effects and before they had a chance to decline, whereas patients on placebo withdrew late and more often because of inefficacy. In consequence, LOCF analyses could actually compare patients on treatment with better scores with patients on placebo with worse scores.
Concern has also been expressed about the varying mixes of mildly and moderately impaired patients in the trials.12 As moderately impaired patients decline more quickly than do mildly impaired ones,14,15 any treatment effect is likely to be more demonstrable with that group. Indeed, it has been demonstrated that the rate of progression of dementia predicts the response to cholinesterase inhibition.16 Thus, from the standpoint of interpreting clinical meaningfulness, using trial data based largely on patients with moderately severe dementia to counsel patients with mild dementia is problematic.
Attention also has been drawn to the difficulty in generalising to daily clinical practice data from clinical trials carried out for regulatory purposes.1–3 The outcome measures used to evaluate ChEIs are not much used in clinical practice. The primary outcomes usually have been the Alzheimer’s Disease Assessment Scale—Cognitive Subscale (ADAS-Cog)17 and a global clinical measure, typically the Clinician’s Interview-Based Impression of Change Plus Caregiver Input (CIBIC-Plus). Tests such as the ADAS-Cog and CIBIC-Plus are seen as surrogate measures compared with “harder” measures, such as a delay in institutionalisation. The Cochrane Collaboration review of donepezil, for example, concluded that “the practical importance of these changes [in the ADAS-Cog] to patients and carers is unclear”. Even though the CIBIC-Plus scores “clearly show some impact on global clinical states ...” “the rating scale is crude and difficult to interpret”.1
This paper seeks to better understand the clinical meaningfulness of ChEIs in AD from the published data. It follows the suggestion that effects will be clinically meaningful if they are statistically significant, large enough to be detectable, demonstrate a dose–response effect, are reproducible, and evidently clinically observable.18 We have also used the opportunity of systematically reviewing the data to gain some insight into the impact of LOCF analyses by comparing the effect sizes of ITT/LOCF with observed case analyses.
METHODS
Search strategy
For the selection of published trials the search strategy of the Canadian Coordinating Office for Health Technology Assessment (CCOHTA) was followed.6 Briefly, the CCOHTA selected trials by standard methodological criteria, which were then subjected to a blinded quality assessment using the Jadad Scale.19 Only those with a quality score of 5 or more were accepted. To maximise comparability, only those ChEI trials that used the ADAS-Cog and a separate global clinical measure were included, and these were restricted to trials with community dwelling patients with mild moderate AD. Qizilbash has urged caution in meta-analyses in dementia.20 Rather than a meta-analyses, a narrative review was undertaken with attention to trial selection, comparability and method of analysis, and with pre-specified criteria of the assessment of clinical meaningfulness.
Herein are summarised data for five trials of donepezil,21–25 three of metrifonate26–28 and two of rivastigmine.29,30 Since the CCOHTA review was published, five additional trials of galantamine have become available and have been included.31–35 We have also included the two tacrine trials that met all criteria36,37 as did three trials of physostigmine.38–40
Operationalisation of the criteria to assess meaningfulness
Statistical significance was assessed through an overview of the published literature, and held to be the case whenever the primary analysis demonstrated that the results were unlikely (p<0.05) to have been observed if the null hypothesis (of no difference between the active treatment and placebo groups) were true.
The criterion of being large enough to be clinically detectable was assessed by estimating effect sizes. Although the term is sometimes used simply to refer to the absolute differences between placebo and treatment groups,12 a standard effect size relates this number to the observed variance in the measures.41 Effect sizes were calculated as either (or both, where available) Cohen’s d or standardised response means (SRMs). Both Cohen’s d and SRMs calculate a “signal”, for any measure, as the mean difference at the endpoint between those on active treatment and those on placebo, given baseline differences (that is, xt2−t1 − yt2−t1, where x is the active treatment group, y is the placebo group, t2 is the endpoint and t1 is the baseline). Both compare this signal in the average difference to an estimate of “noise”: either the pooled baseline deviation (Cohen’s d) or the pooled standard deviation of the change score (SRM). In the calculation of both Cohen’s d and SRM, and given that higher scores of each of the CIBIC-Plus and ADAS-Cog suggest worse disease, effect sizes that favour treatment will have negative values. Each study showed favourable effects, so that, for convenience only the absolute values are presented.
On theoretical grounds, and given that the best bias is conservative—that is, least likely to show a treatment benefit, the choice between Cohen’s d and SRM depends on assumptions about the characteristics of the sample under study. If the sample is artificially homogeneous at the outset (for example, as a result of strict inclusion/exclusion criteria) then the baseline variance will be artificially small, Cohen’s d will be speciously large, and thus SRM would be preferred. On the other hand, if the sample becomes more homogeneous over time (for example, through survivor effects) the opposite would be the case and Cohen’s d would be preferred. As this proposition has not been formally tested in anti-dementia trials, where possible, we present both estimates. Also presented are the absolute differences in relation to overall patterns of improvement or decline. We also estimated these measures with those observed to have completed the trial (observed cases; OC) and with the LOCF in an ITT analysis. Not every study precisely specifies the definition, but here the ITT sample is taken to comprise all patients who received at least one dose of double blind study medication, and for whom data are available from the baseline evaluation and at least one post-baseline assessment. An ITT/OC analysis includes only those patients who received at least one dose of study medication, had a baseline evaluation, and had a final evaluation at the scheduled end of the trial while on double blind study medication. This is also referred to as a “completers” analysis. An ITT/LOCF analysis consists of all patients who received at least one dose of study medication, and had at least one pretreatment evaluation and one evaluation after the start of treatment. The last observation is carried forward and used as a so-called endpoint evaluation.
Few published studies provide baseline standard deviation scores or standard deviations of the change scores, but these can be calculated from the sample size and standard errors of the mean treatment difference or confidence intervals. Whether these differences were large enough to be clinically detectable was considered on two grounds. Effect sizes greater than 0.20 are conventionally held to be clinically detectable.41 In addition, effect sizes for individual trials were correlated with scores on the global clinical measure used in the trial.
Where a dose–response relationship holds, the effect size will show peaks for each dose. In the case of most ChEIs, two doses were assessed: a low dose and a medium-high dose. Where each higher dose is reported separately, separate effect sizes are presented, giving small, medium and high dose effect size estimates. The doses were as follows: donepezil, no low dose, medium dose 5 mg daily, high dose 10 mg daily; rivastigmine, low dose 1.5 mg twice daily, medium-high dose 3.0 mg twice daily or higher; metrifonate, low dose 0.2 mg/kg bodyweight, medium dose 0.3 mg/kg, high dose 0.65 mg/kg; galantamine, low dose 4 mg twice daily, medium dose 8 mg twice daily, high dose 12 mg twice daily or higher. Note that to achieve the highest dose, there is interval dose titration.
The demonstration of a dose response was tested by comparing effect sizes of a given drug across doses of that drug, and likewise between drugs. These data are presented as funnel plots. Funnel plots display the effect size against the sample size.42 They derive their name from the probability property that a sample estimate will more closely approximate the true value of the population parameter the larger the sample size, other things being equal. In consequence, the effect size will “funnel in” on the true value as the sample size increases.
Reproducibility was assessed first by examining the range of effect sizes between trials on the funnel plots. In addition, the distribution of the effect sizes across different ChEIs was observed. In each case, reproducibility was defined as comparability of the effects, considering variable sample size and trial duration, as portrayed in the funnel plots.
The criterion of being “evidently clinically observable” was operationalised as a statistically significant difference on the CIBIC-Plus or like global clinical measure. To summarise these measures, where no baseline variance is possible, and where change score variance terms are rarely presented, the effect size was calculated simply as the absolute difference in the proportions deteriorating, improving, or demonstrating no change. Their size and potential to show dose–response relationship can also be considered as measures of the reproducibility of the data.
RESULTS
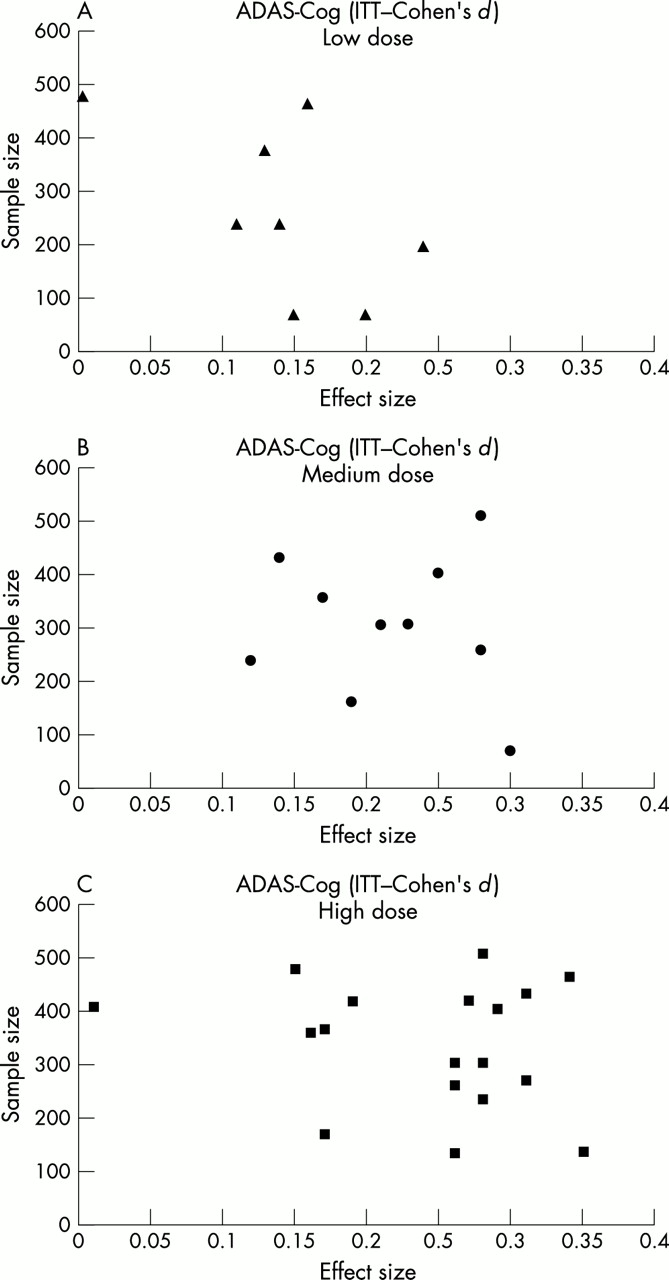
Table 1 presents an overview of the dosing and size of each trial, the ratio of patients screened to those enrolled and the number of withdrawals from each arm of the trial. While withdrawals vary between the trials, there are more withdrawals in the treatment arms than in the placebo arms. Figure 1 presents a funnel plot of the effect sizes of ChEIs on the ADAS-Cog for the ITT/LOCF using Cohen’s d, for the low, medium, and high doses (panels A–C, respectively). Statistical significance was obtained in each of the studies with an effect size of more than 0.15 and a sample size of more than 250 (p<0.05). With four exceptions (from one study each of tacrine, rivastigmine, galantamine, and physostigmine) the high doses of each study showed effect sizes of greater than 0.20 using Cohen’s d and the LOCF/ITT analysis. In every case, the effect size was greater than 0.20 with the highest dose using the SRM. Figure 2 is the funnel plot for the ITT/LOCF using the SRM (panel A) and for the OC (panels B, C) analyses. Individual data points are plotted for each drug at each dose. In the ITT/LOCF analyses using Cohen’s d as the estimate of effect size, peaks are detectable at about 0.15 (panel A) and 0.25, corresponding roughly to low and medium-high doses, respectively. The SRMs (fig 2, panel A) likewise show peaks, at about the median values of 0.26 (low dose) and 0.47 (high dose). As would be expected, the highest estimates are seen in the OC analyses (fig 2, panels B, C), with, for example, a median SRM in the OC medium-high dose studies being 0.56; (range 0.35 to 0.78).
Overview of randomised controlled trials of cholinesterase inhibitors which used the ADAS-Cog and a global clinical measure

ADAS-Cog estimates of the size of the treatment effect (Cohen’s d, intention to treat) by dose (see text for definitions).

Other ADAS-Cog estimates of the size of the treatment effect by type of effect size, and type of analysis, by low, mid (medium), and high doses.
Figure 3 provides some context for these estimates by noting the course of the ADAS-Cog changes in the placebo arms of the trials. With two exceptions, the trials show persistent declines in the placebo arms over time, although the rate of decline varies.

Inter-trial variability on ADAS-Cog placebo responses in Alzheimer’s disease trials.
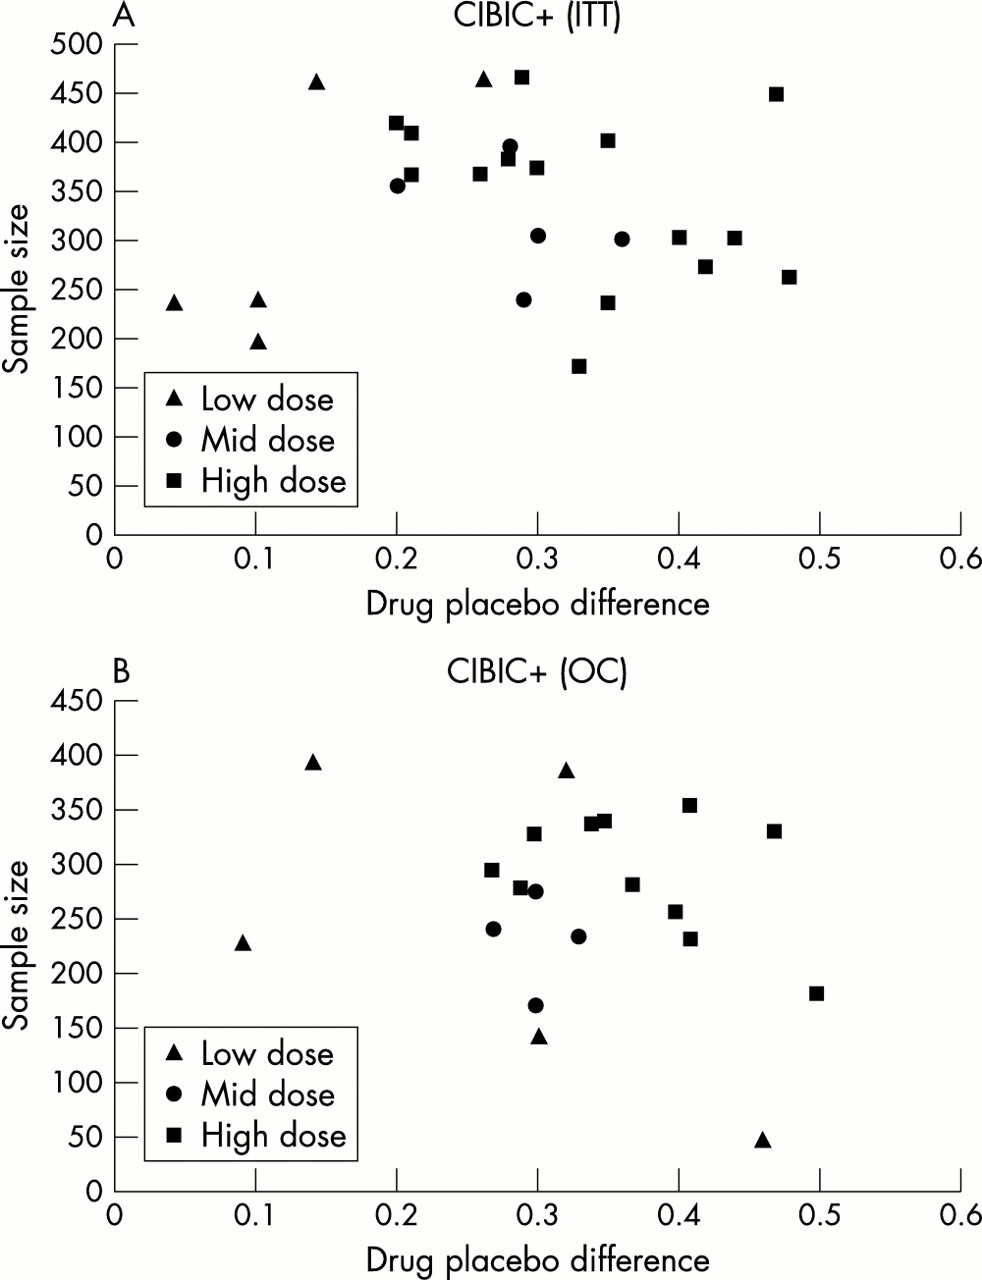
Figure 4 is a funnel plot of the effect sizes of ChEIs on the CIBIC-Plus for the ITT/LOCF (panel A) and OC (panel B) analyses. Individual data points are plotted for each drug at each dose. Again, two peaks are detectable, one about 0.15 and another about 0.25, corresponding to low and medium-high doses, respectively. In general, the global clinical measures produced estimates of effect sizes (where these could be calculated) that were similar to the ADAS-Cog—for example, high dose ChEI, ITT/LOCF median SRM is 0.29 (range 0.20 to 0.47). The correlation of the ADAS-Cog effects sizes to the CIBIC+ effect sizes for ITT analyses was 0.29 for the ITT/LOCF analyses and 0.60 (SRM) for the OC analyses.
Size of the treatment difference in the CIBIC-PLUS raw score, by method of analysis.
DISCUSSION
This study is part of a general strategy to assay the clinical importance of ChEIs. The studies reviewed suggest that anti-dementia drug trials show statistically significant differences that are large enough to be clinically detectable, demonstrate a dose response, are reproducible, and thus have evident clinical meaningfulness.18 Although controversy exists,43 ChEIs appear to have a biologically plausible basis.44,45 In general, ChEIs produce clinically detectable effects on groups of patients treated for AD. The effects appear to be broadly reproducible, to demonstrate a dose response, and to be large enough to be clinically detectable.
These conclusions must be made with important caveats. Not all the data are available from all trials, as some employed different measures of cognition. Still, the ADAS-Cog is now accepted as a standard, and decisions are being made about ChEIs on the basis of this measure, so it is useful to have some insight into its merit in drug trials. Another potential problem is publication bias. As far as can be determined, this report includes all known pivotal studies that employed the ADAS-Cog, for each of the three ChEIs widely used for AD, but we note that there are no estimates with small sample sizes and small effect sizes, which is often a sign of publication bias.42
Another limitation is the generalisability of clinical trial data. Necessarily, the only patients considered in this overview are those who were eligible to take part in clinical trails. Given that dementia and multiple medical comorbidities are all strongly age related,46 many patients who suffer from dementia are not eligible for trials. In addition, many who meet an initial prescreen evaluation are excluded, so that only about 13% of patients referred for trials are enrolled.8 “Real world” effectiveness is therefore a challenge in interpreting clinical meaningfulness,6 although this is not limited to anti-dementia trials.47–50
The present analysis also helps provide some context for new studies. For example, data from two placebo controlled trials of donepezil have been published, which offer some insight into the size of the treatment effects for more than the maximum six months of the studies presented. Mohs et al studied 431 patients in a 54 week trial of donepezil versus placebo.51 The study did not use the ADAS-Cog or CIBIC-Plus, but rather employed a survival analysis of decline in one or more basic Activities of Daily Living. The Mini-Mental State Examination (MMSE)52 was the main cognitive measure. Cohen’s d was 0.13 using the OC analysis, and 0.20 using the LOCF analysis. Winblad et al used the MMSE in a 52 week placebo controlled trial of donepezil.53 We calculated Cohen’s d to be 0.42 using the OC analysis and 0.57 using the LOCF analysis. Thus estimates of long term effects vary between these trials, which have important design differences. Differences in drug effects also appear to exist between domains. For example, a meta-analysis of the impact of ChEIs on behaviour showed that while most produced statistically significant differences, effect sizes typically were less than 0.20.54
Perhaps the most important caveat is that these group effects do not assist in the interpretation of a given effect in a given patient. The trials conducted for regulatory purposes are helpful in telling us that something is going on, but they do not tell us enough about what that is to provide much of a guide for individual patient decisions. This dilemma is perhaps best expressed by the dominance of the “no change” category on the CIBIC-Plus, which remains the single most common summary outcome of treatment. It is generally not the case that patients exhibit no clinically detectable change. Rather, it appears to be that these patients experience changes that the treating clinicians judge to be offsetting—for example, cognitive improvement but functional decline, or functional improvement but behavioural worsening.55,56 Perhaps buried in these summary scores are detectable patterns of change that may consist of reproducible effects of treatments. To mine these patterns, additional strategies are required.57,58 Also, it appears that changes of a given magnitude in a measure such as the ADAS-Cog are variable—that is, a four point change indicating differing treatment effects depends on not just the severity of dementia, but also on the rate of disease progression.16
Still, analysis of effect sizes offers a means of understanding clinical meaningfulness by suggesting where it is likely to occur, and how likely it is to be evident to observers with varying degrees of expertise. It also allows comparison of the responsiveness (sensitivity to change) between measures within a given trial,59 and provides some insight into the effects of new drugs or new indications. For example, the six month data60 on the Ginkgo biloba extract EGb761 in the treatment of AD show effect sizes (Cohen’s d) comparable to the effect sizes of cholinesterase inhibition (ADAS-Cog ITT 0.42 in OC analysis, and 0.33 with ITT/LOCF; Clinical Global Impression of Change (CGIC) 0.29 with OC analysis and 0.18 with ITT). In contrast, the 12 month data61 show an effect size of 0.20 with the ADAS-Cog, and 0 with the CGIC. Similarly, in a six month study in moderate to severe AD, patients on donepezil showed a small degree of improvement on the CIBIC-Plus, compared with continued decline in the placebo control group, resulting in an effect size of 0.49 (ITT/LOCF; the OC analysis was 0.37).62 The effect size (SRM) detected by the CIBIC-Plus in a memantine trial was 0.27 (the absolute difference was 0.3).63 In a placebo controlled study of donepezil in vascular dementia, the effect sizes demonstrated by the ADAS-Cog ranged between 0.30 and 0.37, depending on the dose (5 mg or 10 mg) or whether the LOCF or endpoint analysis was used.64 These estimates were similar to those seen in another trial using galantamine, in which the six month treatment effect size estimated by the ADAS-Cog was 0.35.65
The effect size method thus allows for some quantification, and takes into account response in the placebo group, as does the estimate of the “number needed to treat”66 which also can be seen as a variant of an effect size calculation for proportions.42 These methods thus seem to be superior to estimation of the “minimal clinically important difference” which estimates signal better than noise, and which does not readily capture large placebo related changes.67
As noted, anti-dementia trials face the particular challenge of likely deterioration with or without treatment, and thus the problem of dropout bias, especially when early discontinuation is due to side effects related to medication. If patients exposed to drugs withdraw due to side effects, the effectiveness of the drug would be overestimated by an analysis which did not take dropout into account. In general, the remedy for this is an ITT analysis, employing either of two methods to handle missing data. In the ITT-non-completer equals failure method any patient whose data are missing is considered a treatment failure. Perhaps it was the experience of toxicity with the early ChEIs that persuaded the Cochrane Collaboration reviewers of ChEIs to be sceptical about the otherwise supposed, conservative bias (with respect to placebo effects) of an ITT/LOCF analyses. Although, in theory, early withdrawal can serve either to give a smaller or a larger effect than would have been the case had patients stayed in the trial, the present overview showed the ITT/LOCF analyses to be more conservative than the ITT/OC case analyses. A preferred method is the retrieved dropout analyses, in which patient measures are taken at the scheduled endpoint of the trial, whether they stayed in the study or not. This is not yet the standard for anti-dementia trials.
This study also helps contribute to our understanding of how to interpret the CIBIC-Plus. Although for the grouped data the effect size estimates of the CIBIC-Plus and ADAS-Cog overlapped, the correlations between them were only notional for the ITT/LOCF analyses (~0.30) but higher for the OC analyses (0.60). This suggests both that each measure assays different aspects of the treatment effect,58 in keeping with the original rationale for the use of a global clinical measure,68,69 and that patients who successfully complete studies might have recognisable profiles. The latter is important as clinicians (and thus the CIBIC-Plus) appear to be better at capturing deterioration than at capturing improvement,70 especially if improvement in some domains is seen in the face of deterioration in others.55,56 Such considerations point to a larger and compelling problem, which is not well addressed by the current studies, of how we get to grips with the idea of treatment success in AD, even when that success falls short of cure.71 As argued elsewhere, one important step in getting to grips with how to evaluate this aspect of clinical meaningfulness would be to assay the preferences of patients with AD, and the preferences of their caregivers.57,58,71
Estimation of the achievement of patient and caregiver preferences in anti dementia trials might also allow a better means of comparing drug treatment effects with effects that arise from non-pharmacological interventions. For example, in a meta-analysis of psychosocial interventions for caregivers of people with dementia, Brodaty and colleagues showed that such interventions yielded caregiver benefits of about 0.30 for any main outcome.72 Types of outcomes varied, being most successful in helping with the patient’s mood, and least successful in helping with caregivers’ feelings of burden. Comparing like outcomes with like is important if we are to adjudicate the concern that drug treatment for dementia is claiming more than its fair share if resources.73
In short, with reasonable consistency, ChEIs produce small-moderate effect sizes in clinical trials. A dose response can be demonstrated, and the patterns appear to be replicable both within and across trials. Dropout bias remains a concern in understanding group differences. Better descriptions of the patterns of treatment response are needed if we are to be guided in individual patient decisions about the effectiveness of treatment.
Acknowledgments
The author is grateful to Heather Merry, MSc, for her assistance in preparing the funnel plots and in calculating effect sizes from the published data.
KR is supported by an Investigator award from the Canadian Institutes of Health Research and by the Dalhousie Medical Research Foundation as the Kathryn Allen Weldon Professor of Alzheimer Research.
REFERENCES
Supplementary materials
Publisher's Correction
Please note that there is an error in Figure 1. The corrected version is provided here.
The figure is available as a downloadable PDF (printer friendly file).
If you do not have Adobe Reader installed on your computer,
you can download this free-of-charge, please Click hereFiles in this Data Supplement:
Footnotes
-
Competing interests: The author has conducted trials and/or received research and/or consulting and/or special fees from each of the following companies whose products are included in the review: Bayer; Janssen-Ortho; Novartis; Pfizer.
Linked Articles
- Correction