Article Text

Statistics from Altmetric.com
Whenever we create a test to screen for a disease, to detect an abnormality or to measure a physiological parameter such as blood pressure (BP), we must determine how valid that test is—does it measure what it sets out to measure accurately? There are lots of factors that combine to describe how valid a test is: sensitivity and specificity are two such factors. We often think of sensitivity and specificity as being ways to indicate the accuracy of the test or measure.
In the clinical setting, screening is used to decide which patients are more likely to have a condition. There is often a ‘gold-standard’ screening test—one that is considered the best to use because it is the most accurate. The gold standard test, when compared with other options, is most likely to correctly identify people with the disease (it is specific), and correctly identify those who do not have the disease (it is sensitive). When a test has a sensitivity of 0.8 or 80% it can correctly identify 80% of people who have the disease, but it misses 20%. This smaller group of people have the disease, but the test failed to detect them—this is known as a false negative. A test that has an 80% specificity can correctly identify 80% of people in a group that do not have a disease, but it will misidentify 20% of people. That group of 20% will be identified as having the disease when they do not, this is known as a false positive. See box 1 for definitions of common terms used when describing sensitivity and specificity.
Common terms
Sensitivity: the ability of a test to correctly identify patients with a disease.
Specificity: the ability of a test to correctly identify people without the disease.
True positive: the person has the disease and the test is positive.
True negative: the person does not have the disease and the test is negative.
False positive: the person does not have the disease and the test is positive.
False negative: the person has the disease and the test is negative.
Prevalence: the percentage of people in a population who have the condition of interest.
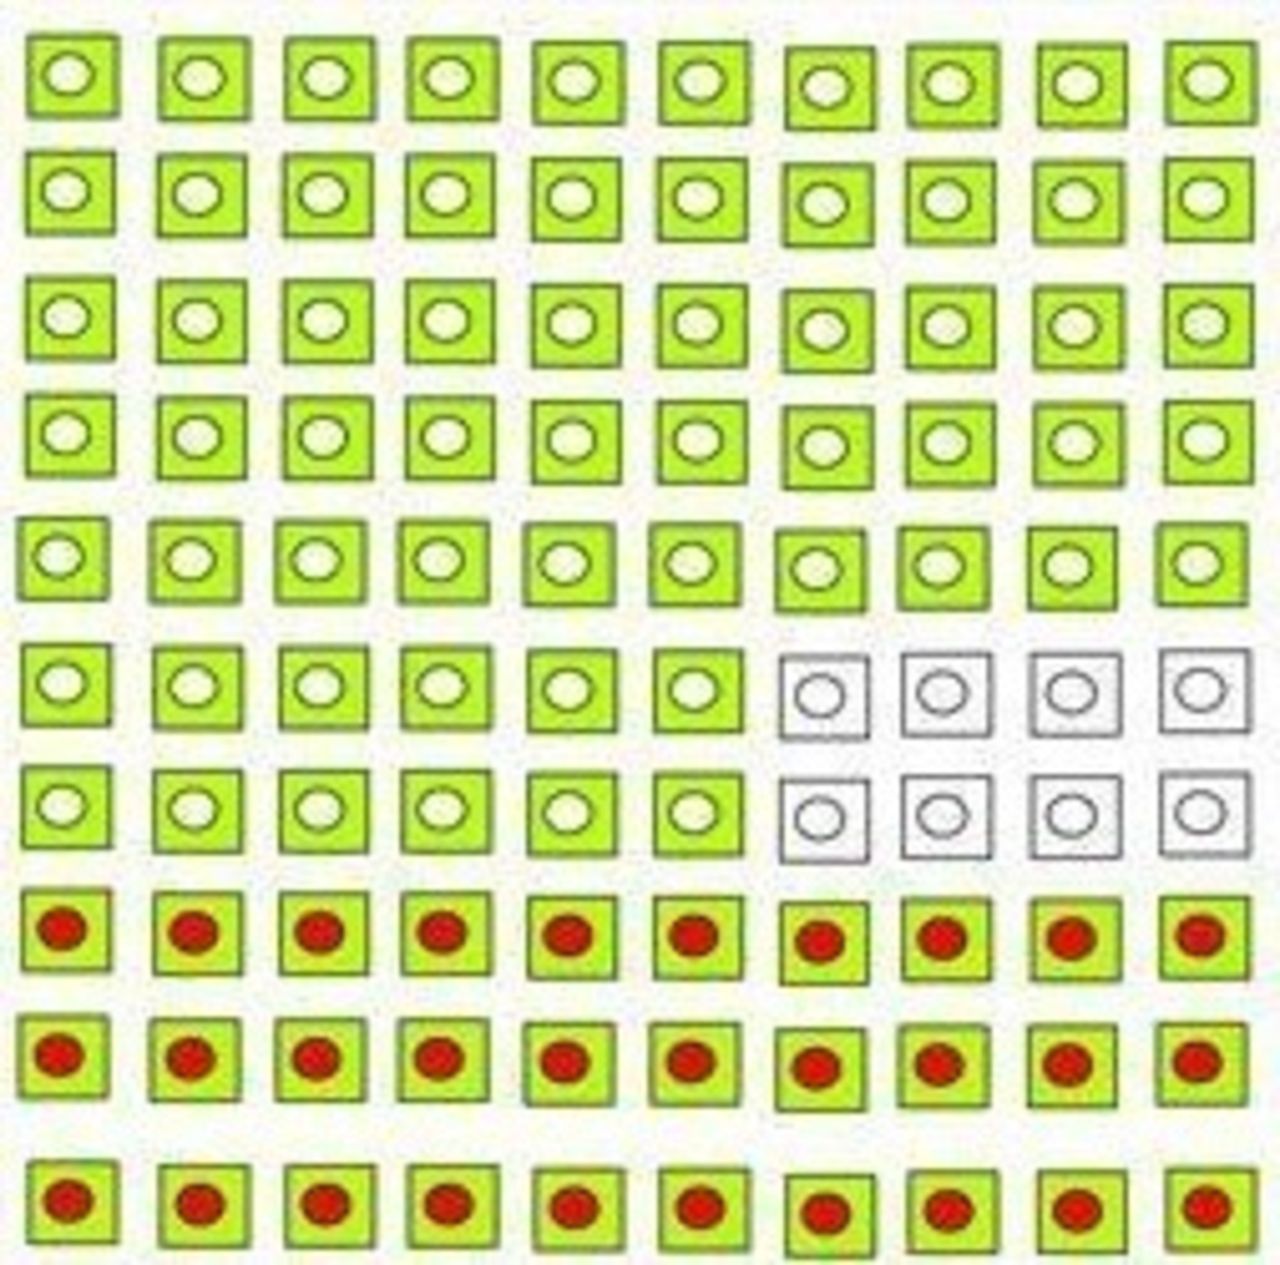
These terms are easier to visualise. In our first example Disease D is present in 30% of the population (figure 1).

Prevalence of 30% (figure adapted from Loong13). Each square represents a person. The red circle represents a person with Disease D. A blank circle represents a person without Disease D.
We want a screening test that will pick out as many of the people with Disease D as possible—we want the test to have high specificity. Figure 2 illustrates a test result.

Test result.
Sensitivity is calculated based on how many people have the disease (not the whole population). It can be calculated using the equation: sensitivity=number of true positives/(number of true positives+number of false negatives). Specificity is calculated based on how many people do not have the disease. It can be calculated using the equation: specificity=number of true negatives/(number of true negatives+number of false positives). If you are mathematically minded you will notice that we are calculating a ratio comparing the number of correct results with the total number of tests done. An example is provided in box 2.
Calculation of sensitivity and specificity from figure 2 test result
In our example (figure 2):
Sensitivity=18/(18+12)=0.6
Specificity=58/(58+12)=0.82
Because percentages are easy to understand we multiply sensitivity and specificity figures by 100. We can then discuss sensitivity and specificity as percentages. So, in our example, the sensitivity is 60% and the specificity is 82%. This test will correctly identify 60% of the people who have Disease D, but it will also fail to identify 40%. The test will correctly identify 82% who do not have the disease, but it will also identify 18% of people as having the disease when they do not. These are good numbers when we compare with some screening tests for which there are high stakes outcomes. A good example of this is screening for cervical cell changes that might indicate a high likelihood of cancer.
Meta-analysis suggests that the cervical smear or pap test has a sensitivity of between 30%–87% and a specificity of 86%–100%.1 This means that up to 70% of women who have cervical abnormality will not be detected by this screening test. This is a poor performing test and has led to a suggestion that we add in or switch instead to screening for high-risk variants of the human papilloma virus, which has a higher sensitivity.2 However, low sensitivity can be compensated for by frequent screening, which is why most cervical screening policies rely on women attending every three tofive years.
There is a risk that a test with high specificity will capture some people who do not have Disease D (figure 3). The screening test in figure 2 will capture all those who have the disease but also many who do not. This will cause anxiety and unnecessary follow-up for well people. This phenomenon is currently a concern in medicine, discussed as over-detection, over-diagnosis and over-treatment—together these could be described as over-medicalisation. Over-detection is the identification of an abnormality that causes concern but if left untreated is unlikely to cause harm. Mammography, the radiographic detection of potential breast tumours, is thought to have an over-detection rate of between 7% and 32%.3 The emotional and economic costs of this have led to the development of decision-aids to help women make an informed decision about undergoing screening.4
High specificity.
Let us consider some further examples. Imagine that you have 100 patients in your emergency department (ED) waiting room who have all presented with an acute ankle injury. Ankle injuries are very common, but fractures are only present in approximately 15% of cases.5 The gold standard test for an ankle fracture is an X-ray but because so few ankle injuries are fractures it is considered inappropriate to X-ray everyone. Doing so would result in unnecessary exposure to X-rays, lengthy waits for patients, and added expense. However, it is important to be able to identify fractures so that the most appropriate management strategy can be applied. Therefore, we need a way to determine who is most likely to have a fracture, and then we can send only those patients for X-ray confirmation. In 1992 a group of Canadian physicians created a set of rules, called the Ottawa ankle rules,6 which can be used by the clinician to decide who needs an X-ray and have been incorporated into national guidance in many countries.7
The Canadian group examined many features associated with ankle injury to see which were most predictive of fracture and determined that just four were required relating to tenderness in particular areas and an inability to weight-bear. When these rules are applied clinically, they have been shown (in a systematic review) to correctly identify approximately 96% of people who have a fracture and to correctly rule out between 10% and 70% of those who do not have a fracture.8 The wide range of sensitivity is likely to be due to differences in the education of the clinicians involved in the studies from which those results derive. We can use our 100 patients waiting in the ED to show how these figures are calculated. We know from the research that approximately 15 people out of the 100 waiting will have an ankle fracture, the rest will have various strains and sprains. A specificity of 96% means that when the rules are applied almost everyone who has a fracture will be selected for an x-ray, which can be used to confirm the fracture and direct treatment. We can show this through a calculation. The prevalence of ankle fracture is 15%, so the true positive in our equation should be 15 out of 100 people in the ED. If the specificity is 95% we can substitute the numbers we know into the equation that was given earlier to help us find out what the number we do not know is. The number we do not know is the number of false negatives - people who have an ankle fracture that these rules would miss. When we do this we find the number of false negatives is less than 1 in 100 (0.96 = 15/(15+x); x=0.63). A sensitivity of 10-70% means that the rules will correctly identify between 10 and 70%. Using the same process as before we can use the equation to determine how many false positives there might be - people who are thought to have a fracture who do not. The equation for the lower specificity (0.1=85/(85+x) =765) shows that up to 765 might be sent for an unnecessary x-ray. The equation for the higher spedificity (0.7=85/(85+x)=3), meaning only 36 people would be sent for an unnecessary x-ray. This illustrates something key about sensitivity and specificity—it is rare that a test achieves high scores for both and that it is important that the test is used accurately and consistently.
It is important to know and understand the clinical implications of the sensitivity and specificity of diagnostic tests. The Prostate Specific Antigen (PSA) is one example. This test has a sensitivity of 86% meaning it is good at detecting prostate cancer, but a specificity of only 33%, which means there are many false positive results. A PSA may be elevated for several reasons, including when there is an increased prostate volume, such as in benign prostatic hyperplasia. Two-thirds of men who have an elevated PSA do not have prostate cancer. Many countries have national guidelines to help providers identify men who would most benefit from a PSA, given the inaccuracy of the PSA.9 However, it can be confusing for men who qualify whether or not to have the test and requires health promotion counselling by their healthcare provider.
It is also important to know and account for the sensitivity and specificity of a diagnostic test, or examination, when one is included in a research study. For example, researchers conducting studies where one variable is the measurement of BP must understand that the sensitivity and specificity vary considerably. Measurements of BP for patients with hypertension in clinics have sensitivity rates between 34% and 69% and specificity between 73% and 92%. Home measurements for hypertensive patients have sensitivity of 81%–88% and specificity of 55%–64%.10 These wide variations mean that single measurements of BP have little diagnostic value.11 and using them to determine effectiveness of a research intervention, or to allocate a patient to a treatment group in a research study would be misleading. Justice et al 12 articulate the issues succinctly:
If symptoms are to be recognized and effectively addressed in clinical research, they must be collected using sensitive, specific, reliable, and clinically meaningful methods.
In summary, an understanding of sensitivity and specificity of diagnostic and physical assessment tests is important from both a clinical as well as research perspective. This knowledge puts healthcare providers in a better position to counsel patients about screening, results and treatment. The constructs are not the easiest to understand or to communicate to others. However, patient-centred care, and the ethical requirement for autonomy demands that we support patients to make good decisions about whether to undergo screening, what the results might mean, the importance of regular attendance to maximise chance of detection, and the probability of the result being incorrect. Fallibility is not failure or an indicator of poor care but failing to equip patients with complete information is an example of failure to support informed consent.
Footnotes
Twitter @nurseswift, @robertaheale, @alitwy
Funding The authors have not declared a specific grant for this research from any funding agency in the public, commercial or not-for-profit sectors.
Competing interests None declared.
Patient consent for publication Not required.
Provenance and peer review Not commissioned; internally peer reviewed.
Linked Articles
- Miscellaneous