Article Text

Statistics from Altmetric.com
Introduction
A nurse educator is interested in finding out the academic and non-academic predictors of success in nursing students. Given the complexity of educational and clinical learning environments, demographic, clinical and academic factors (age, gender, previous educational training, personal stressors, learning demands, motivation, assignment workload, etc) influencing nursing students’ success, she was able to list various potential factors contributing towards success relatively easily. Nevertheless, not all of the identified factors will be plausible predictors of increased success. Therefore, she could use a powerful statistical procedure called regression analysis to identify whether the likelihood of increased success is influenced by factors such as age, stressors, learning demands, motivation and education.
What is regression?
Regression analysis allows for investigating the relationship between variables.1 Usually, the variables are labelled as dependent or independent. An independent variable is an input, driver or factor that has an impact on a dependent variable (which can also be called an outcome). For example, if we were to say age affects academic performance of students, what will be the independent and dependent variables here? Well here age is an independent variable, and it has the potential to impact on outcome/dependent variable—in this case, academic performance. Similarly, in the nurse educator's example, critical thinking is a dependent variable and age, experience and training are independent variables.
Purposes of regression analysis
Regression analysis has four primary purposes: description, estimation, prediction and control.1 ,2 By description, regression can explain the relationship between dependent and independent variables. Estimation means that by using the observed values of independent variables, the value of dependent variable can be estimated.2 Regression analysis can be useful for predicting the outcomes and changes in dependent variables based on the relationships of dependent and independent variables. Finally, regression enables in controlling the effect of one or more independent variables while investigating the relationship of one independent variable with the dependent variable.1
Types of regression analyses
There are commonly three types of regression analyses, namely, linear, logistic and multiple regression. The differences among these types are outlined in table 1 in terms of their purpose, nature of dependent and independent variables, underlying assumptions, and nature of curve.1 ,3 However, more detailed discussion for linear regression is presented as follows.
Comparison of linear, logistic and multiple regression
Linear regression and interpretation
Linear regression analysis involves examining the relationship between one independent and dependent variable. Statistically, the relationship between one independent variable (x) and a dependent variable (y) is expressed as: y= β0+ β1x+ε. In this equation, β0 is the y intercept and refers to the estimated value of y when x is equal to 0. The coefficient β1 is the regression coefficient and denotes that the estimated increase in the dependent variable for every unit increase in the independent variable. The symbol ε is a random error component and signifies imprecision of regression indicating that, in actual practice, the independent variables are cannot perfectly predict the change in any dependent variable.1 Multiple linear regression follows the same logic as univariate linear regression except (a) multiple regression, there are more than one independent variable and (b) there should be non-collinearity among the independent variables.
Factors affecting regression
Linear and multiple regression analyses are affected by factors, namely, sample size, missing data and the nature of sample.2
Small sample size may only demonstrate connections among variables with strong relationship. Therefore, sample size must be chosen based on the number of independent variables and expect strength of relationship.
Many missing values in the data set may affect the sample size. Therefore, all the missing values should be adequately dealt with before conducting regression analyses.
The subsamples within the larger sample may mask the actual effect of independent and dependent variables. Therefore, if subsamples are predefined, a regression within the sample could be used to detect true relationships. Otherwise, the analysis should be undertaken on the whole sample.
Example
Building on her research interest mentioned in the beginning, let us consider a study by Ali and Naylor.4 They were interested in identifying the academic and non-academic factors which predict the academic success of nursing diploma students. This purpose is consistent with one of the above-mentioned purposes of regression analysis (ie, prediction). Ali and Naylor’s chosen academic independent variables were preadmission qualification, previous academic performance and school type and the non-academic variables were age, gender, marital status and time gap. To achieve their purpose, they collected data from 628 nursing students between the age range of 15–34 years. They used both linear and multiple regression analyses to identify the predictors of student success. For analysis, they examined the relationship of academic and non-academic variables across different years of study and noted that academic factors accounted for 36.6%, 44.3% and 50.4% variability in academic success of students in year 1, year 2 and year 3, respectively.4
Ali and Naylor presented the relationship among these variables using scatter plots, which are commonly used graphs for data display in regression analysis—see examples of various scatter plots in figure 1.4 In a scatter plot, the clustering of the dots denoted the strength of relationship, whereas the direction indicates the nature of relationships among variables as positive (ie, increase in one variable results in an increase in the other) and negative (ie, increase in one variable results in decrease in the other).

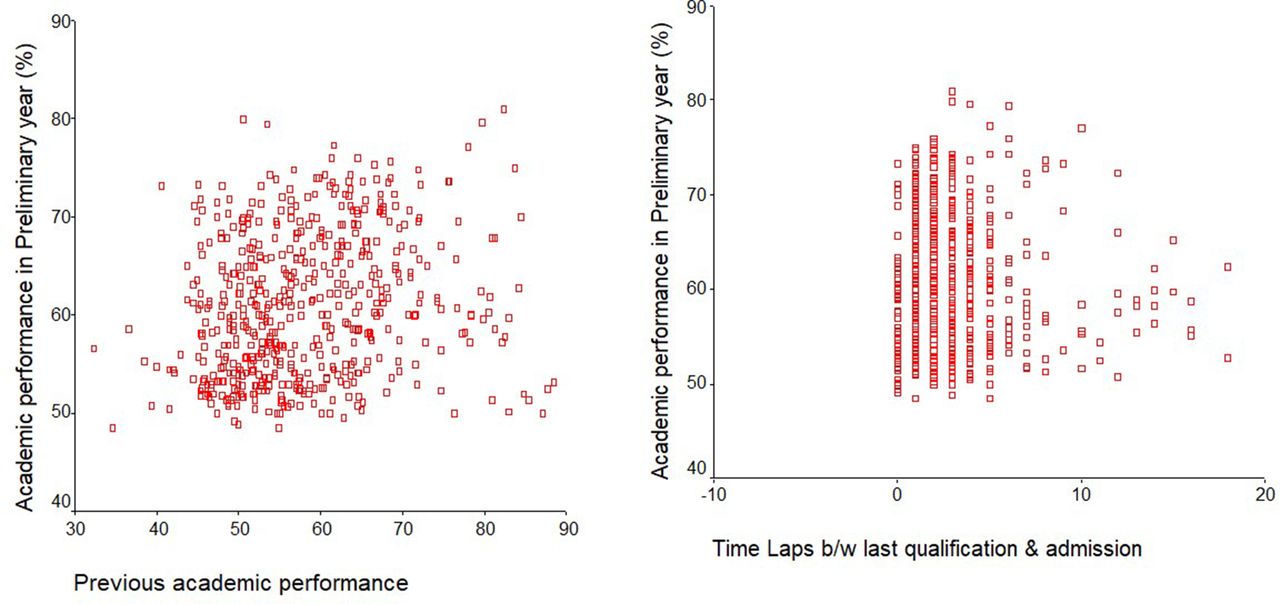
An Example of Scatter Plot for Regression.
Table 2 presents the results of regression analysis for academic and non-academic variables for year 4 students’ success. The significant predictors of student success are denoted with a significant p value. For every, significant predictor, the beta value indicates the percentage increase in students’ academic success with one unit increase in the variable.
Regression model for the final year students (N=343)
Conclusions
Regression analysis is a powerful and useful statistical procedure with many implications for nursing research. It enables researchers to describe, predict and estimate the relationships and draw plausible conclusions about the interrelated variables in relation to any studied phenomena. Regression also allows for controlling one or more variables when researchers are interested in examining the relationship among specific variables. Some of the key considerations are presented that may be useful for researchers undertaking regression analysis. While planning and conducting regression analysis, researchers should consider the type and number of dependent and independent variables as well as the nature and size of sample. Choosing a wrong type of regression analysis with small sample may result in erroneous conclusions about the studied phenomenon.
Ethics statements
Footnotes
Twitter @parveenazamali, @@Ahtisham04
Funding The authors have not declared a specific grant for this research from any funding agency in the public, commercial or not-for-profit sectors.
Competing interests None declared.
Provenance and peer review Commissioned; internally peer reviewed.